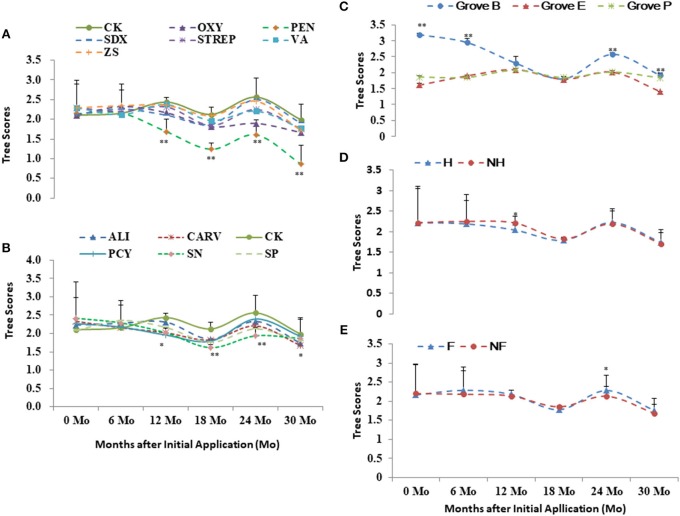
Figure 3.
Tree scores of the integrated managements treated by chemical (A,B: the abbreviations listed in Table 1), heat (D: H, heat treatment; Non-H, without heat treatment) and additional nutrition (E: F, additional nutrition; Non-F, without additional nutrition) in each grove (C: groves B, E and P). * and ** significance at 0.05 and 0.01 probability level, respectively.

