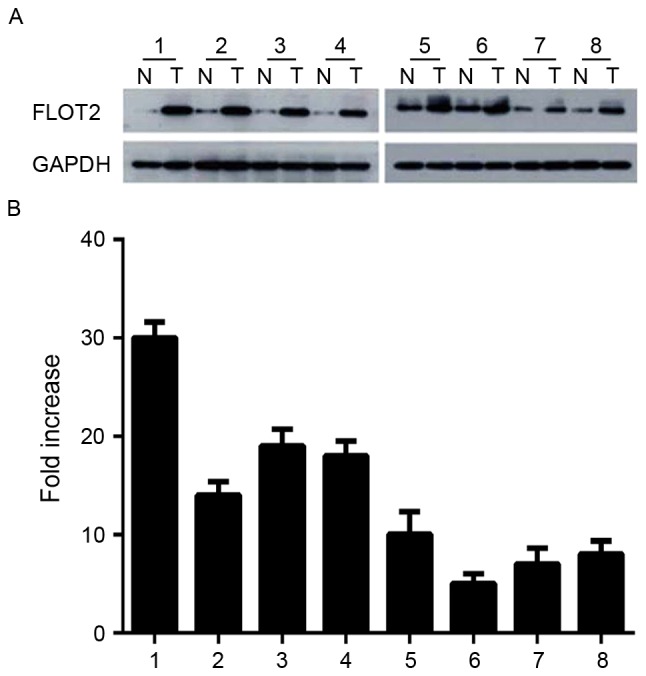
Figure 2.

Expression of FLOT2 is increased in colorectal cancer tissues. (A) Tissues were analyzed by western blotting. GAPDH served as a loading control. (B) Mean T/N ratios of FLOT2 mRNA expression were determined following quantification using the reverse transcription-quantitative polymerase chain reaction. Results are expressed as the mean ± standard error of the mean. T, tumor tissues; N, adjacent non-tumor tissues.
