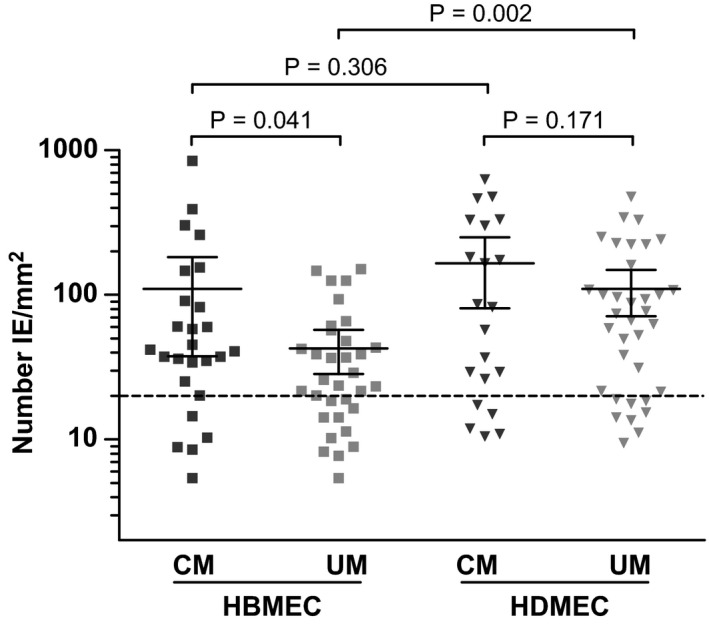
Figure 2. Cytoadherence of IE from CM and UM cases to HBMEC and HDMEC .

IE were isolated, and binding to HBMEC and HDMEC was determined under flow conditions. Number of IE bound per mm2 EC surface was calculated and shown is the mean ± 95% CI for 26 CM and 33 UM cases on HBMEC and 21 CM and 35 UM cases on HDMEC on a log scale. P‐value was calculated by two‐tailed unpaired t‐test. The dotted line is 20 IE/mm2, the cut‐off value for inclusion of the inhibition data.
