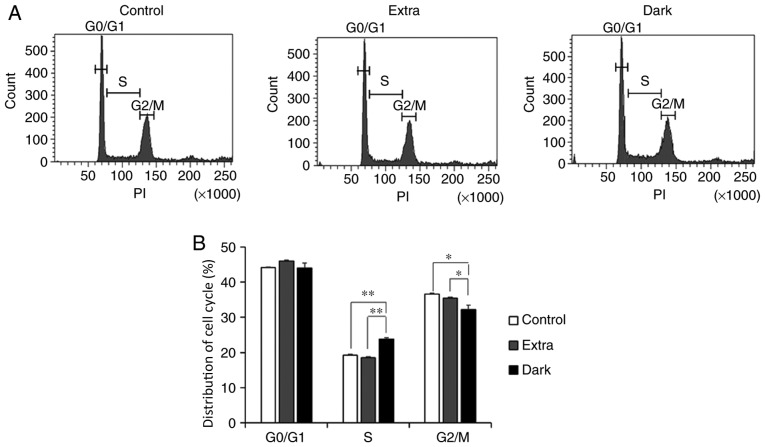
Figure 4.
Flow cytometry analysis of cell cycle progression in maple syrup-treated DLD-1 cells. (A) Representative histograms of cell cycle distribution in maple syrup-treated DLD-1 cells. (B) Data is presented as the mean ± standard error of the mean of three independent experiments in maple syrup-treated DLD-1 cells. *P<0.05 and **P<0.01. PI, propidium iodide; Extra, extra light maple syrup; Dark, dark-colored maple syrup.

