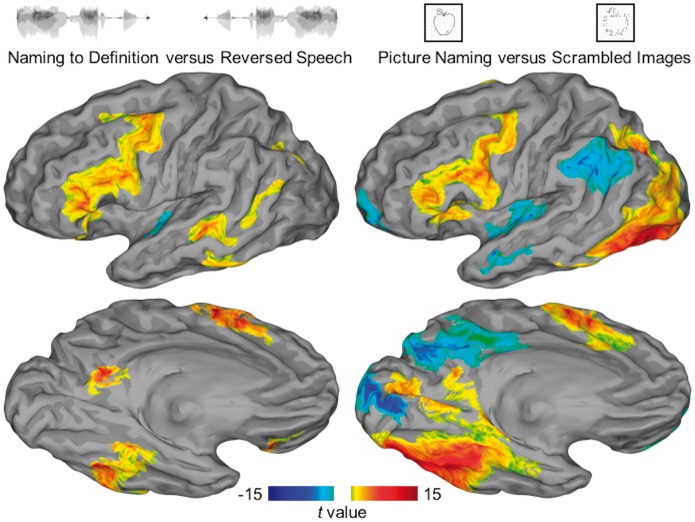
Figure 3.
SB-MEMA of functional MRI. Surface-based group-level functional MRI represented on standard N27 surface. The contrast of auditory naming versus reversed speech is shown on the left; the contrast of picture naming versus scrambled images is shown on the right. Regions surviving a significance threshold (P < 0.01, corrected) are shown scaled by the model confidence—those with a preference for the semantic condition are shown in warm colours and for the control condition in cool colours.

