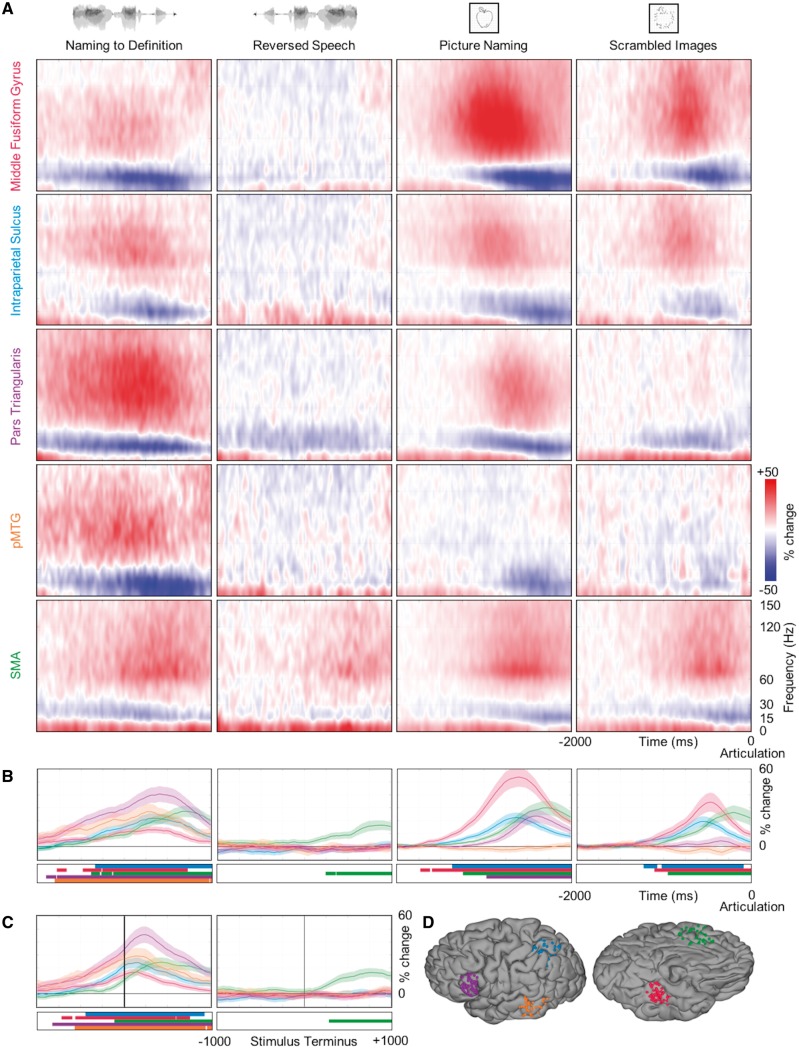
Figure 6.
Temporal dynamics of lexical semantic network. Spectrotemporal responses at regions of interest. (A) Spectrograms show group estimates of the full spectrotemporal profile of each region (rows) in the 2 s before articulation for each condition (columns). (B) Time series show group estimates of BGA per cent change ± 1 standard error of the mean in the 2 s before articulation for each condition. Data are smoothed with a Savitsky-Golay filter (third order, 251 ms length). Significant increase from baseline is indicated by horizontal bars (paired t-test, P < 0.01, FDR corrected). (C) For the two auditory conditions, the same BGA estimates are shown aligned to the end of the stimulus. (D) Each anatomical region of interest is defined by a geodesic radius around a centre coordinate (Supplementary Table 1). All electrodes within each region are displayed on a standard N27 surface.

