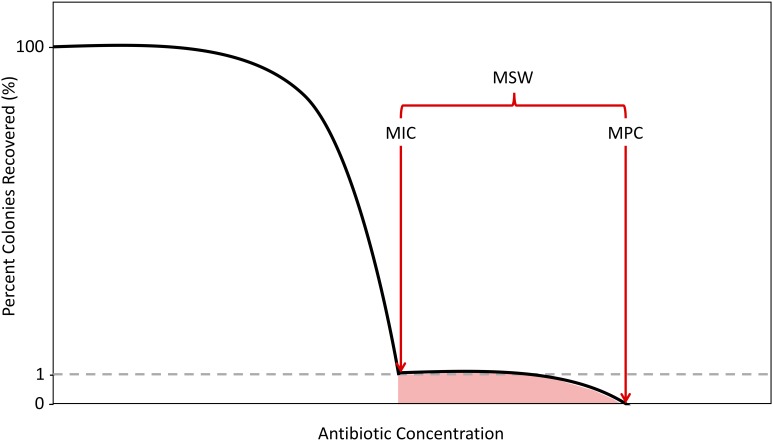
FIGURE 1.
Schematic of the Mutant Selection Window. As antibiotic concentrations increase, the percentage of colonies recovered decreases with two sharp declines demarcating the boundaries of the mutant selection window (MSW), in red. The shaded region selects for single-step resistant mutants. The first decline, which results in a 99% decrease in colonies recovered is determined to be the minimum inhibitory concentration (MIC). The second decline, where there is a 100% decrease in colonies recovered is determined to be the mutation prevention concentration (MPC).

