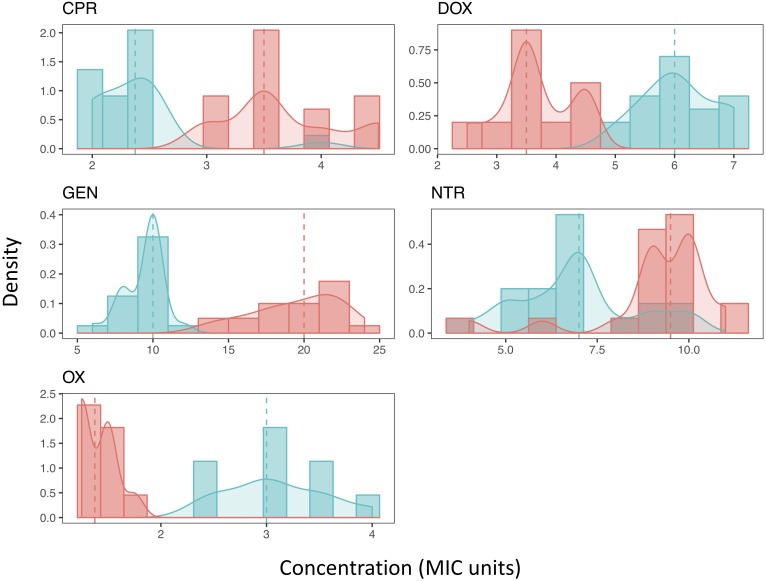
FIGURE 2.
The distribution of Mutant Prevention Concentrations. The MPC distribution of both the ancestral strain (blue) and antibiotic resistant strain (red) for each antibiotic tested. Both the histograms of the data along with the kernel-density estimation is shown. The dashed line represents the median of each sample, respectively. A Shapiro-Wilk test (p < 0.05) and Kolmogorov-Smirnov test (p < 0.001) both show that all resistant strains distributions cannot be considered normal. Most ancestral strains are also not considered to be a normal distribution (p < 0.05), the distribution of the MPCs of the ancestral strain when exposed to either DOX or NTR fail to reject the null hypothesis of a Shapiro-Wilk test (p > 0.05). Furthermore, when comparing the MPC distributions between the ancestral strain and the resistant strain for each antibiotic the distributions are not the same (2-sample Kolmogorov-Smirnov test, p < 0.001).

