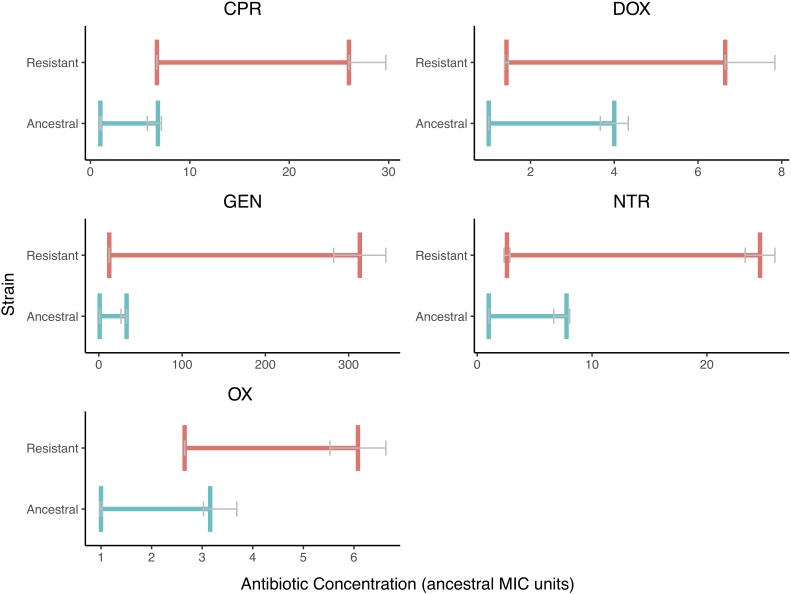
FIGURE 3.
The Mutant Selection Windows of the Ancestral and Resistant Strains. The mutant selection window windows are shown for both resistant (red) and ancestral (blue) strains for each of the five drugs tested. The MIC and MPC shown here are the median value with error bars (IQR) represented in gray. The mutant selection windows for the resist stain are all shifted to higher values and are wider in size. The MPC appears to vary more in the resistant strain than in the ancestral strain.

