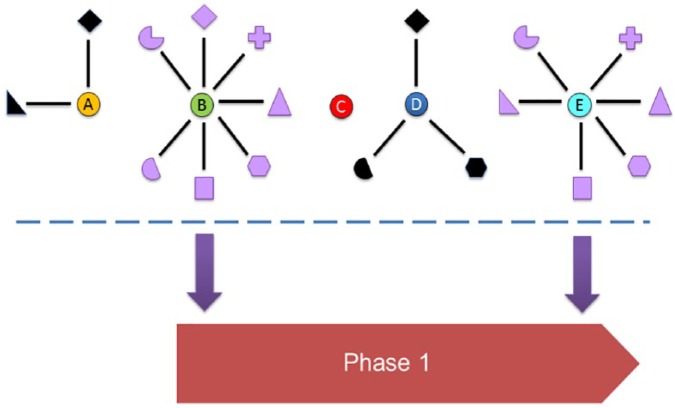
Figure 2.
Diagrammatic representation showing how the availability of research studies that support candidate genes can influence their selection to enter the biomarker research pipeline (phase 1, see Figure 1). Five genes (A-E) are shown. Genes A, B, D, and E are connected to functional studies (surrounding symbols) that support that gene as a candidate biomarker within a particular cancer type. Functional studies performed in different cancer types are shown as distinct symbols, with black symbols denoting bona fide published studies and purple symbols denoting fraudulent published studies. Without an understanding that genes B and E have been systematically targeted for the fraudulent production of manuscripts in series, genes B and E appear to be the best biomarker candidates and would be most likely to be selected for further biomarker studies. This decision could exclude genes A and D, which are supported by bona fide research, and which could in fact represent superior candidates.

