
Fig. 1.
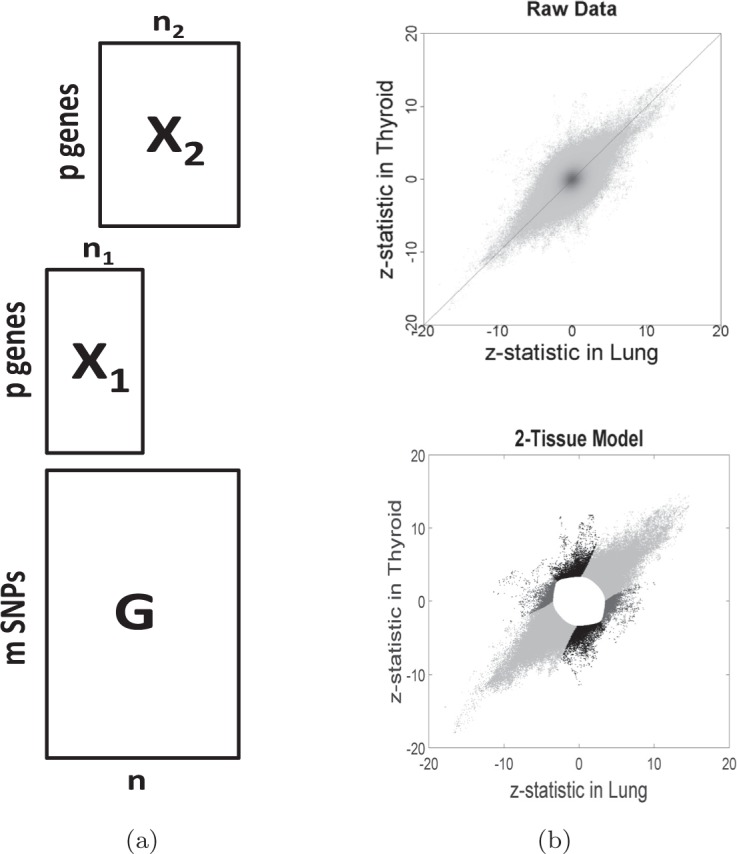
(a) Illustration of the typical data format with two tissues. Genotype data
 is available for
 SNPs and each of
 samples. Expression measurements are
available for
samples. Expression measurements are
available for  genes; sample sets for different
tissues may not be the same. (b) z-statistics for lung and thyroid: density plot for all
local gene–SNP pairs (top), and scatter plot for significant local gene–SNP pairs with
tissue specificity by gray scale (bottom). The gene–SNP pairs deemed insignificant are
omitted, leading to the white space at the center of the plot. The remaining points are
colored according to their assessed tissue specificity: dark gray points correspond to
the Lung-specific eQTL; black points correspond to the Thyroid-specific eQTL; light gray
points correspond to the cross-tissue eQTL.
genes; sample sets for different
tissues may not be the same. (b) z-statistics for lung and thyroid: density plot for all
local gene–SNP pairs (top), and scatter plot for significant local gene–SNP pairs with
tissue specificity by gray scale (bottom). The gene–SNP pairs deemed insignificant are
omitted, leading to the white space at the center of the plot. The remaining points are
colored according to their assessed tissue specificity: dark gray points correspond to
the Lung-specific eQTL; black points correspond to the Thyroid-specific eQTL; light gray
points correspond to the cross-tissue eQTL.