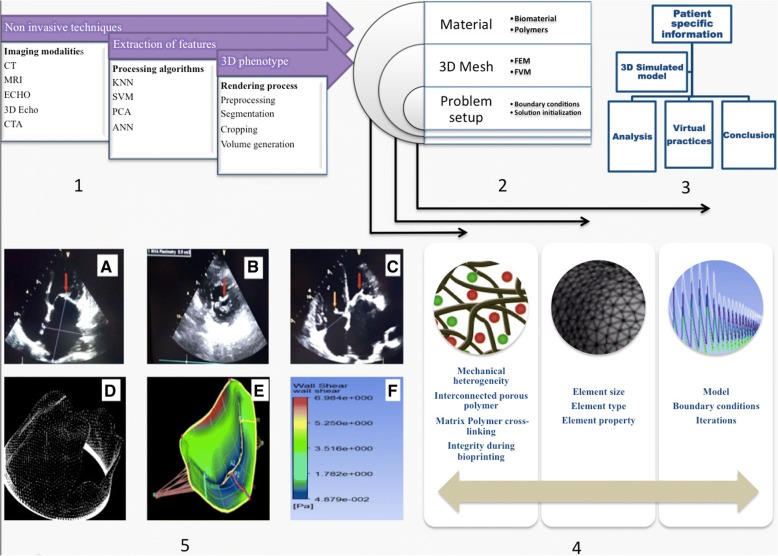
Fig. 1.
Schematic representation of the cardiovascular modeling process for patient specific diseases diagnostics. Processes 1, 2 and 3 show the sequential steps whereas step 4 and 5 shows conditions for real time processing. a. Thick and calcific Mitral valve with decreased opening in case of Chronic Rheumatic Heart Disease, (b). Parasternal Short Axis view of Mitral valve showing thickened anterior and posterior leaflets with reduced valve area, (c). Four Chamber view showing thickened Tricuspid Valve (yellow arrow) suggestive of organic Tricuspid valve disease and thick and calcific Mitral valve (red arrow) in case of Rheumatic Heart Disease, (d). 3D mesh for the volume generated geometry. e. Numerical setup for the problem in CFD software, F. Result post processing.)

