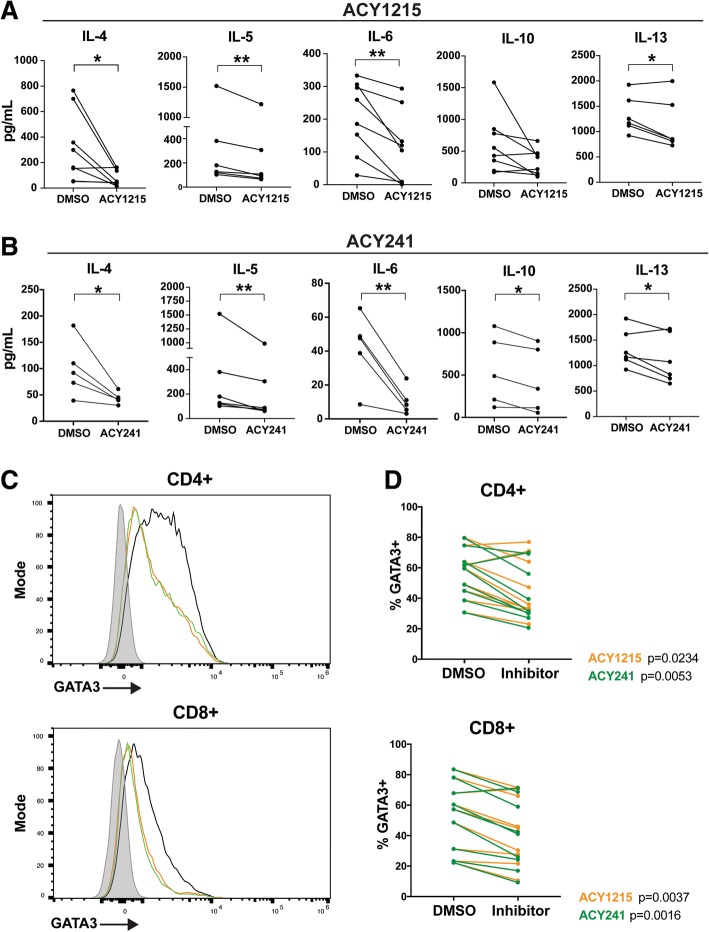
Fig. 2.
ACY-1215 and ACY-241 decrease Th2 cytokine production by T-cells. T-cells isolated from melanoma patient PBMC samples were treated with DMSO, (a) ACY-1215 500nM, or (b) ACY-241500nM, and activated for 72 h. Supernatant cytokines were assessed by Luminex. At least five patient samples were evaluated across three experiments for each cytokine and HDACi treatment assessed. Each paired line represents an individual patient sample. *p < 0.05, **p < 0.01. (c) GATA3 expression was assessed by flow cytometry in T-cells treated with DMSO, ACY-1215 500nM, or ACY-241500nM, and activated for 72 h. Representative histograms for CD4+ and CD8+ T-cells are shown for DMSO (black), ACY-1215 (orange), ACY-241 (green) and fluorescence minus one (FMO) control (grey). (d) CD4+ and CD8+ T-cells expressing GATA3 in DMSO control and paired inhibitor-treated samples are graphed. (c-d) Results shown are from nine patients evaluated across three experiments

