Fig. 3.
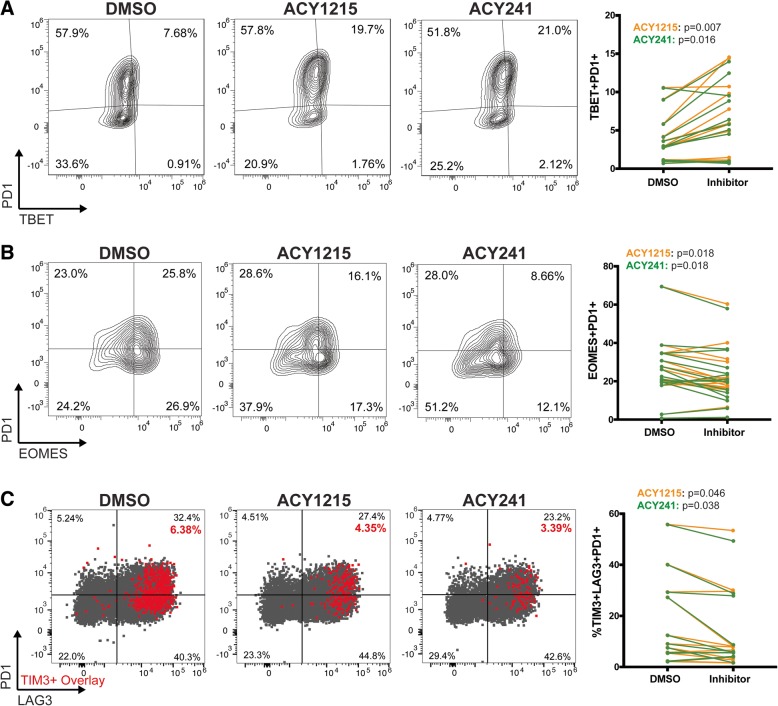
T-cells cultured with ACY-1215 or ACY-241 have reduced exhaustion associated phenotypes. T-cells from melanoma patient PBMCs were expanded with the indicated inhibitor (500nM), activated for 24 h, and evaluated by flow cytometry. Representative contour plots and paired analyses of percentages of CD8+ T-cells expressing (a) PD1 and TBET from twelve samples, (b) PD1 and EOMES from fifteen samples and (c) CD8+ T-cells expressing PD1, TIM3 and LAG3 from eleven samples are shown. Representative dot plots of PD1 vs LAG3 expression with TIM3+ cells overlaid in red are shown along with paired analyses (ACY-1215: orange lines, ACY-241 green lines). (a-c) Results shown are from over eleven patient samples assessed in three to five experiments. Each paired line represents an individual patient sample

