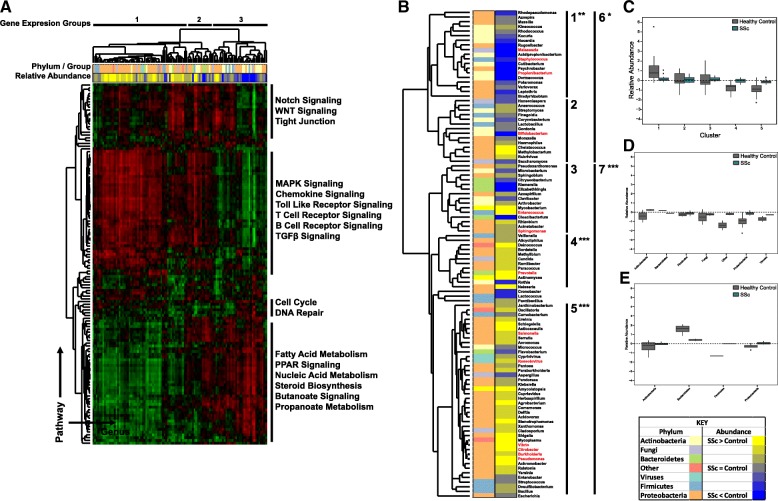
Fig. 4.
Microbiome composition is associated with pathway activation in SSc skin. Single-sample gene set enrichment analysis (ssGSEA) was run against normalized FPKM values for all 36 patient samples, using curated KEGG pathways as the probe gene sets. A correlation matrix was then generated by calculating Pearson’s correlations for all combinations of ssGSEA values and genus-level abundance across all patients. a Hierarchical clustering of the correlation matrix revealed strong associations between SSc-associated gene expression pathways and microbial composition. b Taxonomic clustering based on gene expression. Hash marks indicate phylum/group associated with each sample. Relative abundance indicates the degree to which each genus is differentially present in SSc patients, relative to controls with yellow indicating abundance is higher in SSc, while blue indicates abundance is higher in controls. Black bars indicate KEGG pathways that clustered together hierarchically, with representative pathways listed alongside each cluster (*p < 0.05; ** p < 0.01; *** p < 0.001 by paired t-test). Clinically relevant genera are highlighted in red. c Relative abundance of all genera by taxonomic cluster. d, e Distribution of taxa is shown for cluster 5 (d) and cluster 3 (e)

