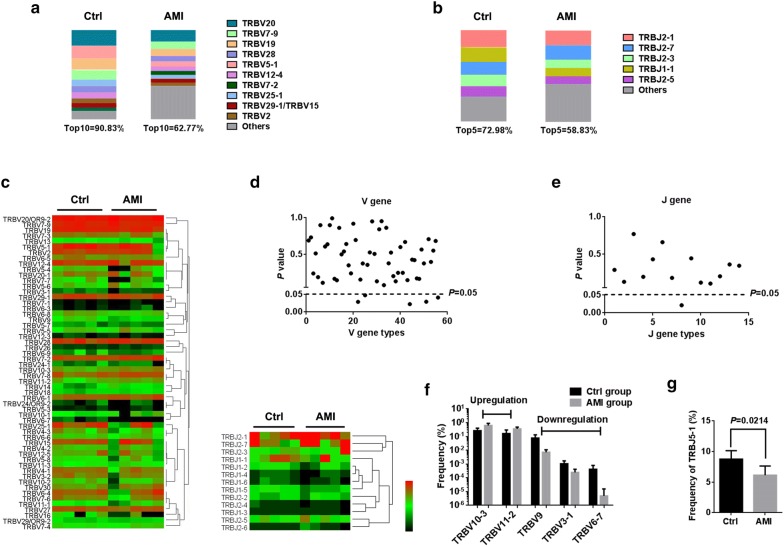
Fig. 2.
The usage patterns of V and J gene segments after AMI. High-throughput sequencing of 10 PCR products (five controls and five AMI patients) amplified from peripheral lymphocytes for TCRβ repertoire analysis. The distribution of Top10V (a) and Top5J (b) genes expression. Colors indicate Top10/Top5 clones (each color represents a clone); grays represent non-Top10/Top5 clones. c Heatmaps of hierarchical clustering of V and J gene segments frequencies. The frequencies of V (d, f) and J (e, g) gene segments usage that had significant differences between healthy controls and AMI patients

