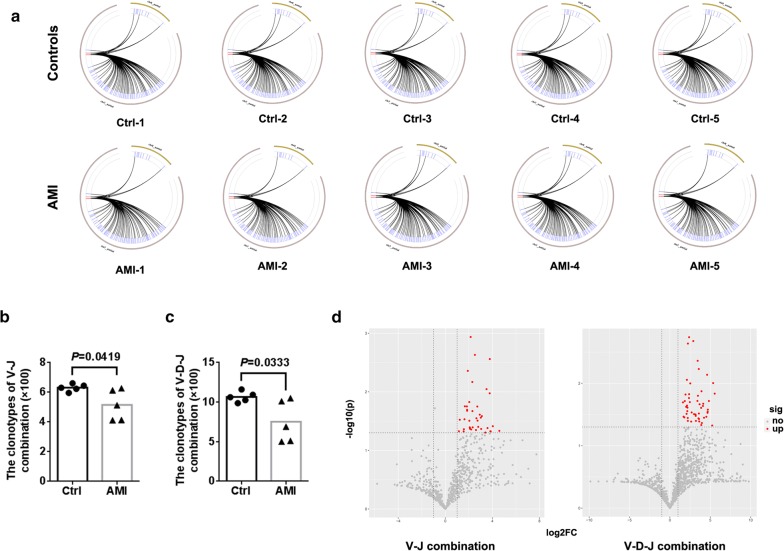
Fig. 3.
The usage patterns of V–J and V–D–J combination. a Circular plots representing TCRβ loci were identified from αβ T cells. The clonotypes of V–J (b) and V–D–J (c) combinations were counted from sequencing data. d Volcano plots showing the comparison of V–J and V-D–J combinations between healthy controls and AMI patients (red dots refer to the differentially expressed combinations with statistical significance)

