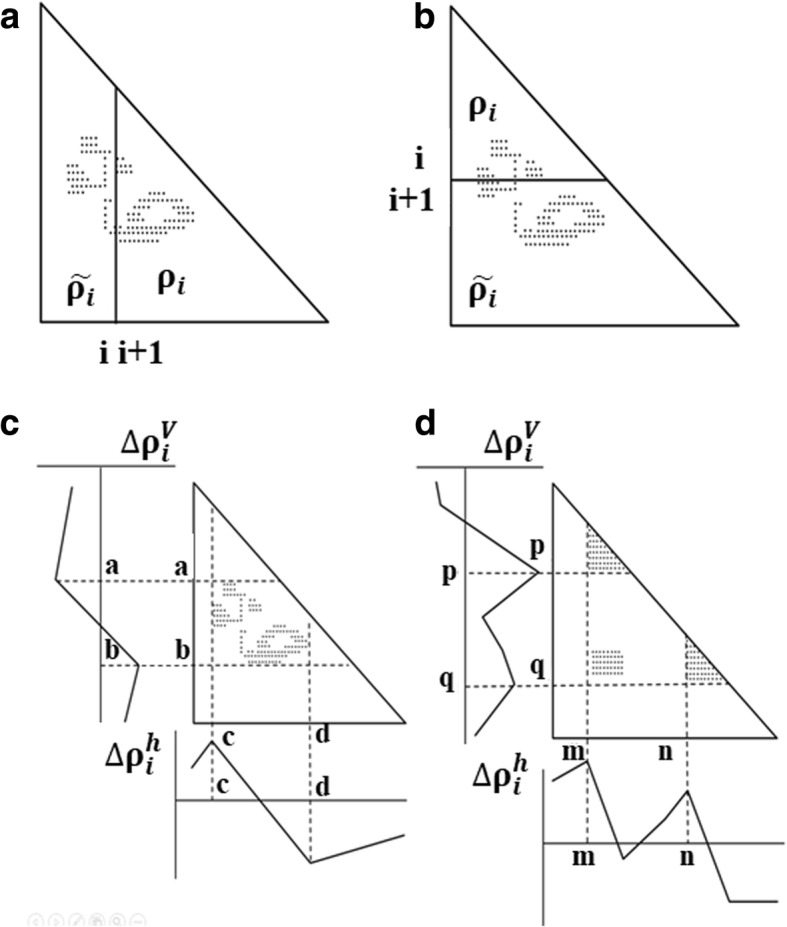
Fig. 1.

Schematic drawing of a map divided by a line parallel to the y-axis at the i-th residue (a) and divided by a line parallel to the x-axis at the i-th residue (b). The density of plots in the trapezoidal part and the triangular parts are denoted by ρi and , respectively. c Schematic drawing of a map with some plots. A peak and a valley appear at the boundaries of a highly dense region of plots. This map predicts that many plots will form between the segments a–b and c–d. d Hypothetical map with two compact areas near the diagonal along with the horizontal and vertical scanning plots. This map predicts the existence of two domains at the regions p–q and m–n. We define η as a measure of the compactness of the region, namely, or
