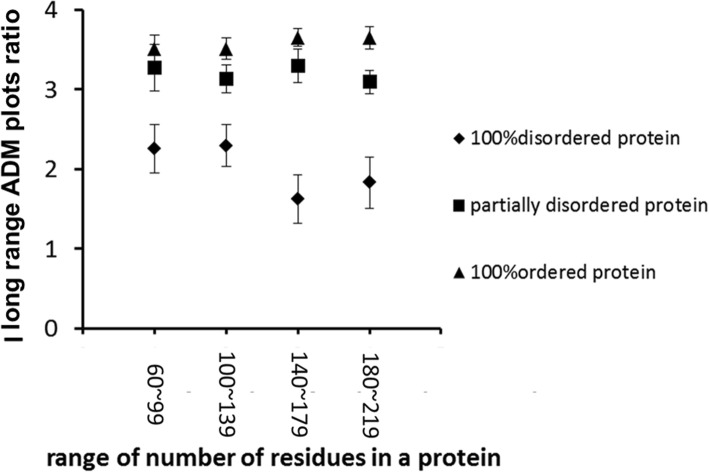
Fig. 3.
Plot of the average long-range ADM plot ratio values versus the window widths of 40 residues in proteins. A triangle, a rectangle, and a diamond denote completely ordered, partially disordered, and completely disordered proteins, respectively. “ADM plots ratio” refers to the ratio of the number of plots to the total number of residues in a given protein. Ted by more than 8 residues are counted in the ADM plot ratio calculation. An error bar is presented at each point, denoting the standard error value

