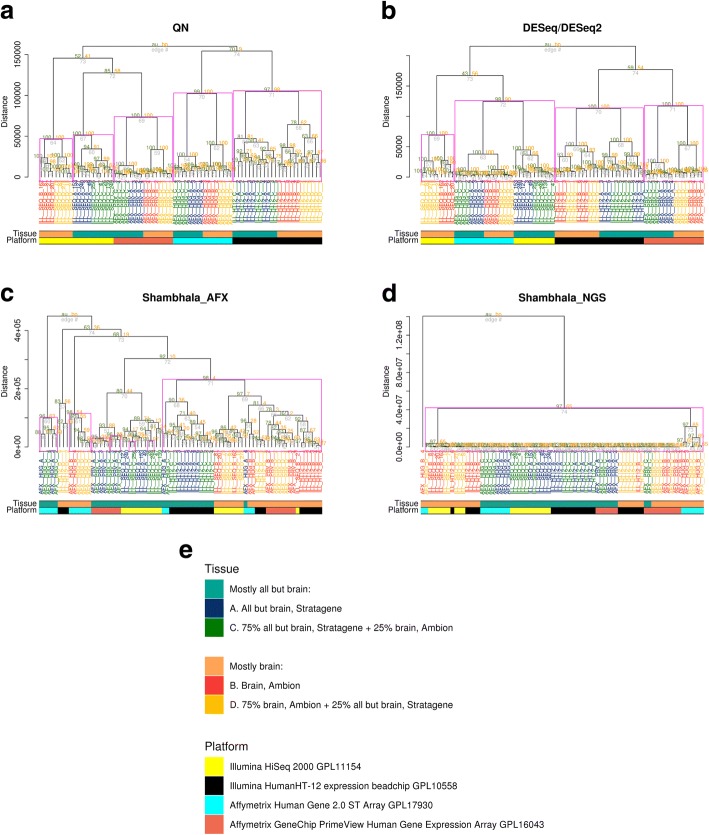
Fig. 4.
Hierarchical clustering at the level of individual gene expression for SEQC project data. Panel a – results following quantile normalization (QN); b – DESeq/DESeq2; c – Shambhala with Affymetrix microarray Q-dataset; d – Shambhala with Illumina HiSeq 2000 Q-dataset. Panel e – legend explaining origin of biosamples A, B, C, D and experimental platform in the project. To facilitate the visual analysis of the hierarchical clustering dendrogram, we selected randomly only 20 profiles out of 1324 that were obtained using the Illumina HiSeq 2000 (GPL11154) platform. More detailed view of the dendrograms is given in Additional file 6

