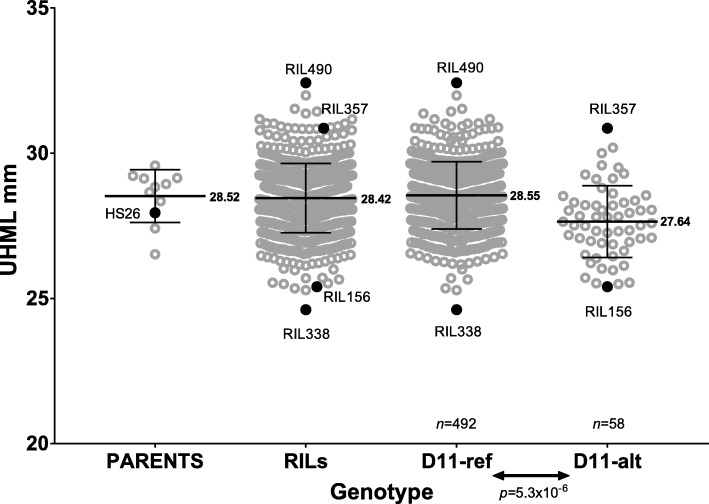
Fig. 2.
Phenotypic differences in fiber length between MAGIC subpopulations of RILs possessing D11-ref and D11-alt haplotypes. UHML is Upper Half Mean Length. Black lines indicate mean values of fiber length with numerical value at right. Error bars are standard deviation within tested populations. Significant difference in fiber length between D11-ref and D11-alt MAGIC populations was detected by a parametric (two-tailed) t-test. Grey circles represent normalized fiber length for each individual RIL measured at twelve different environments [24–26]; black dots represent the parent (HS26) that contributed the D11-alt haplotype and the longest and shortest RILs from both populations which were selected for RNAseq analysis

