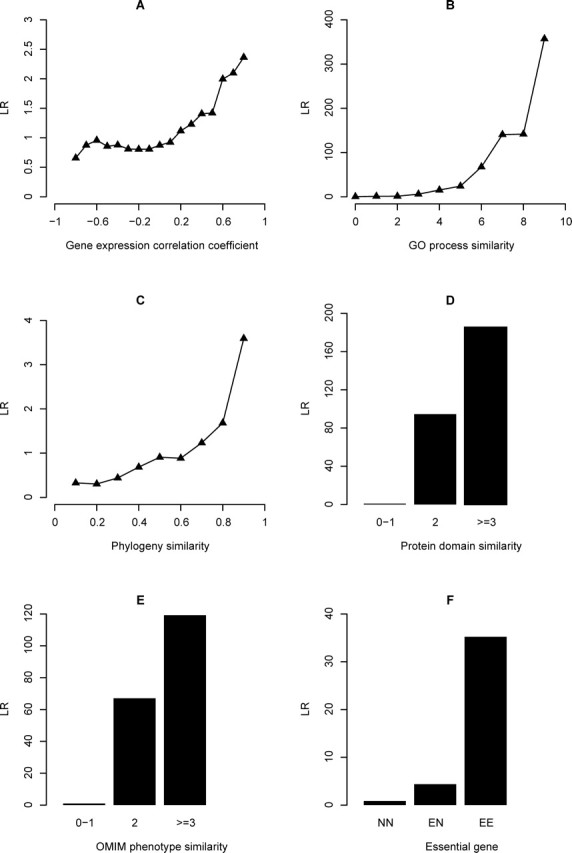
Fig. 1.

The predictive power of six genomic features for the functional association of gene pairs in the human fetal ovary. LR values represent the predictive power of each genomic feature and were calculated based on feature values of gold standards. For each genomic feature, gene pairs were grouped according to feature values. A) Gene coexpression was quantified by correlation coefficients between −1 and 1. B) GO term similarity in the subontology Biological Process was quantified by semantic similarity scores ranging from 0 to 10. C) Phylogeny similarity was the fraction of species in which two genes were either both present or both absent. D) Protein domain similarity was quantified by the –log10(p). Gene pairs were classified into three groups based on domain similarity values. E) OMIM phenotype similarity was quantified by the –log10(p). Gene pairs were classified into three groups based on phenotype similarity values. F) Gene pairs were classified into three groups: both are essential genes, one is essential, and both are nonessential.
