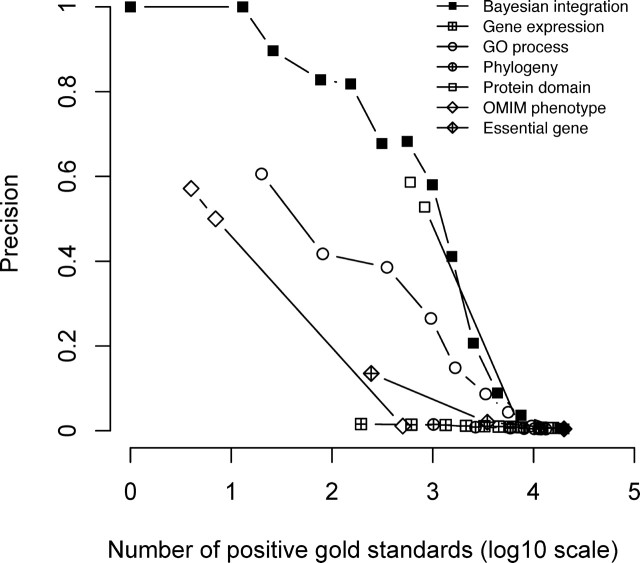
Fig. 3.
Performance evaluation of Bayesian integration and individual genomic features. Precision is the ratio of positive gold standards to all gold standards with LR values above a threshold, while the number of positive gold standards (coverage) is marked in the x-axis. For precision, higher numbers are better, and the ideal value is 1. For coverage, higher numbers are better, and the ideal value is 20 034, representing the total count of positive gold standards. The precision-coverage curves were obtained by taking different LRs as the threshold to calculate precision and coverage values.

