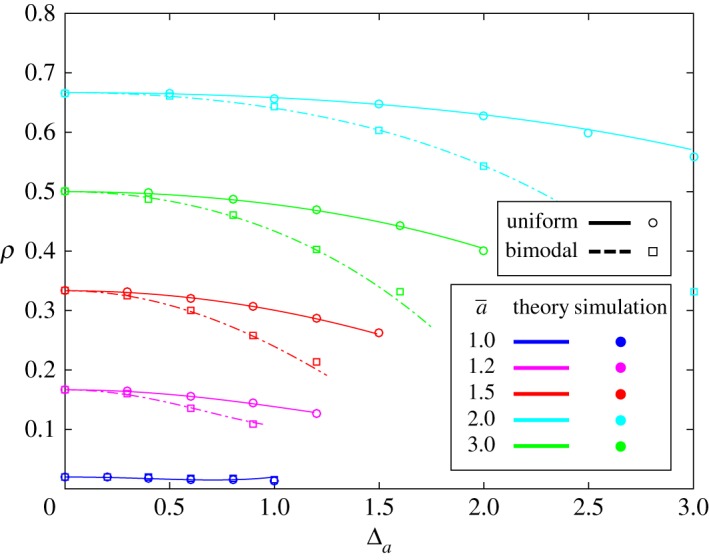
Figure 2.

Fixation probability of the mutant type, A, as a function of (half) the width of the mutant fitness distribution, Δa. The fitness values for the mutant and resident are uniformly distributed on and , respectively (solid line). Similarly, for a bimodal distribution, the fitness values for the mutant and resident are or and and , respectively, each with probability (dashed lines). These values, Δa and Δb, are measures of mutant and resident heterogeneity, respectively. The population size is N = 50 and the solid/dashed lines indicate the analytical predictions from equation (3.8). As Δa grows, a beneficial mutant’s fixation probability decreases. However, this fixation probability does not change as Δb varies (not shown in the figure).
