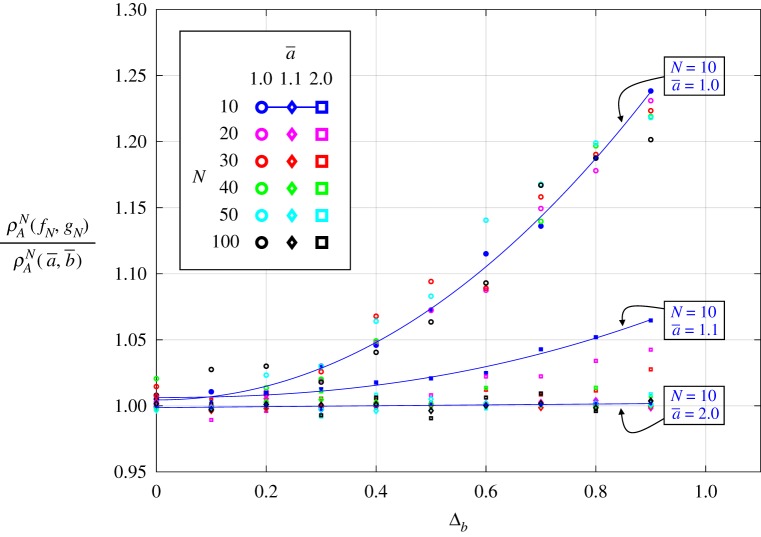
Figure 6.
Fixation probability for various population sizes, N, and mutant-fitness averages, . The heterogeneity is on resident fitness, using a uniform distribution function, i.e. 1 − Δb ≤ bi ≤ 1 + Δb. The fixation probability is normalized to that of uniform population with Δb = 0. The shapes (circle/diamond/square) indicate simulation results for various , and solid lines are interpolations for N = 10 and .

