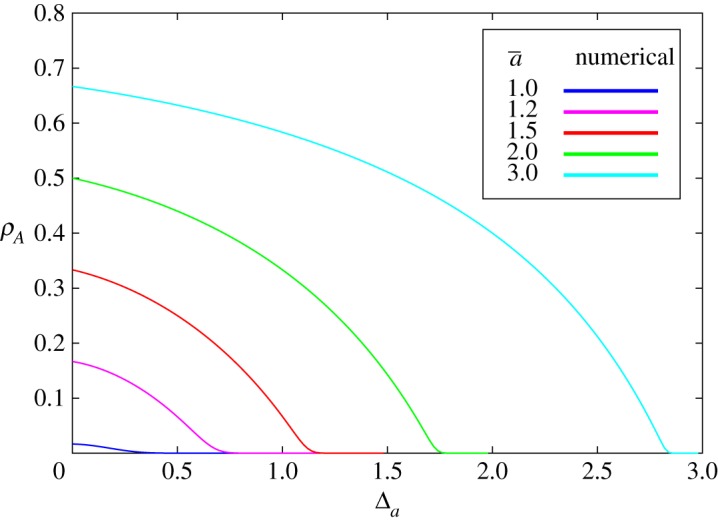
Figure 8.

Fixation probability of the mutant type, A, as a function of (half) the width of the mutant’s fitness distribution, Δa. The fitness values for the mutant are either or . The fitness values of the resident are set to unity and do not change across population. Every location in environment 1 (resp. 2) is a neighbour to two individuals in environment 2 (resp. 1). The population size is N = 100, and . The results are obtained from exact solutions of the Kolmogorov equation for fixation probability. As Δa grows, a mutant’s fixation probability decreases, consistent with suppression. However, the effect is more significant than it is when the dispersal structure is a complete graph.
