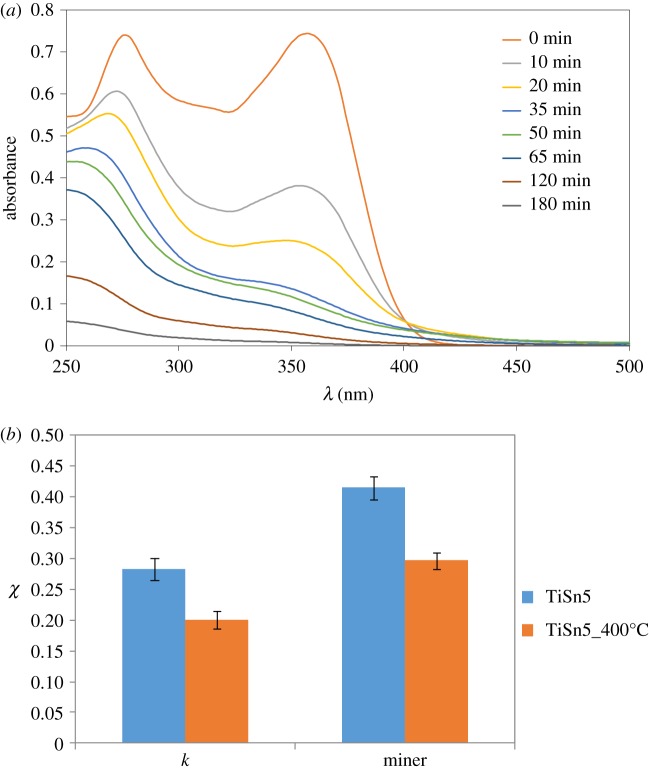
Figure 6.
(a) UV–vis spectra of TC solution as a function of irradiation time during photocatalytic tests; (b) comparison of the photocatalytic activity of TiO2/SnO2 composites with same Sn content and different heat treatment method: pseudo first-order kinetic constant (×10−3 min−1) and mineralization degree, normalized by the photocatalyst surface area.

