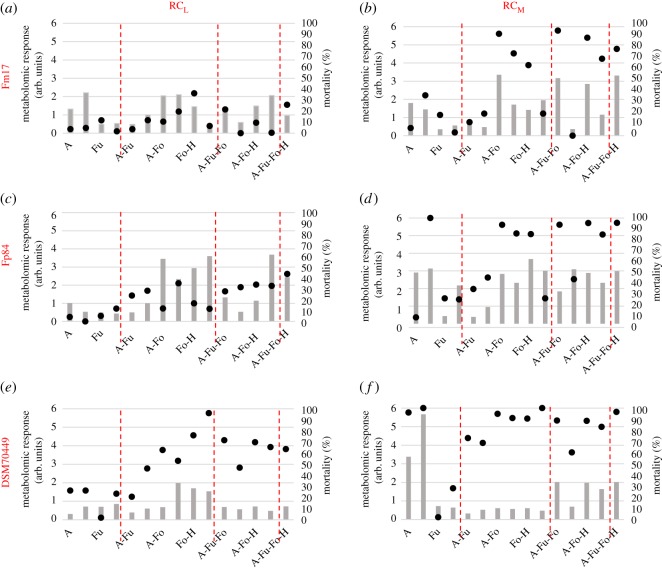
Figure 3.
Stress response (GSI) and mortality of Fm17, Fp84 and DSM70449 strains challenged by single inhibitors, binary, ternary or quaternary inhibitor mixtures at low and medium relative concentrations (RCL and RCM). Grey bars represent GSI calculated as normalizations of the Euclidean distances between the response spectra of cells under stress and those of cells maintained in water. The degree of variability between replicas throughout the FTIR spectra ranged around 2.5 × 10⁻². Black dots represent mortality values as the mean of three replicates with the relative standard error always being less than 5% (not reported).

