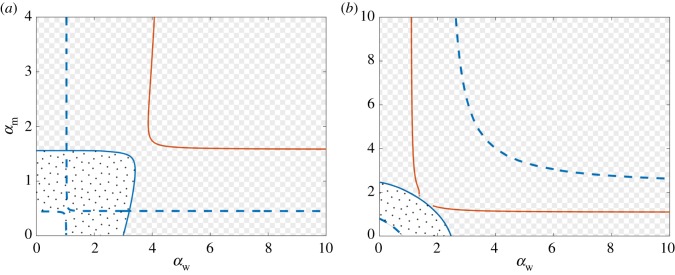
Figure 8.
Co-dimension two bifurcation diagrams in terms of the wt and mutant virus infection rates αw and αm when backwards mutation is possible. The mutation rates are (a) μm = 10−3 and μw = 10−1 and (b) μm = 10−1 and μw = 10−1. All other parameters are given by (3.12). Dashed and solid lines correspond to transcritical and Hopf bifurcations, respectively. Blue denotes biologically feasible equilibria undergoing the bifurcations (all components non-negative), while colour orange denotes bifurcations of equilibria with negative components. The non-patterned, polka-dot and checkerboard regions correspond to virus-free, stationary coexisting, and oscillatory coexisting states, respectively.

