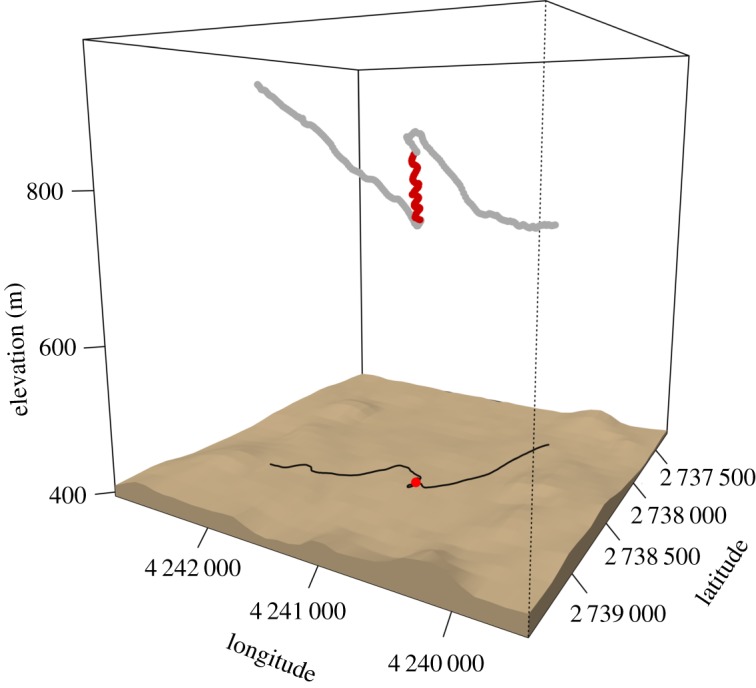
Figure 2.

Example of behavioural segmentation based on the GPS data of one stork. The figure shows the classified three-dimensional trajectory after smoothing; the red segment was identified as soaring flight, grey corresponds to gliding flight. Data for plotting the surface are provided by the EU-DEM. The black line and the red point on the ground represent the two-dimensional projection of the trajectory and the centroid of the soaring segment, respectively.
