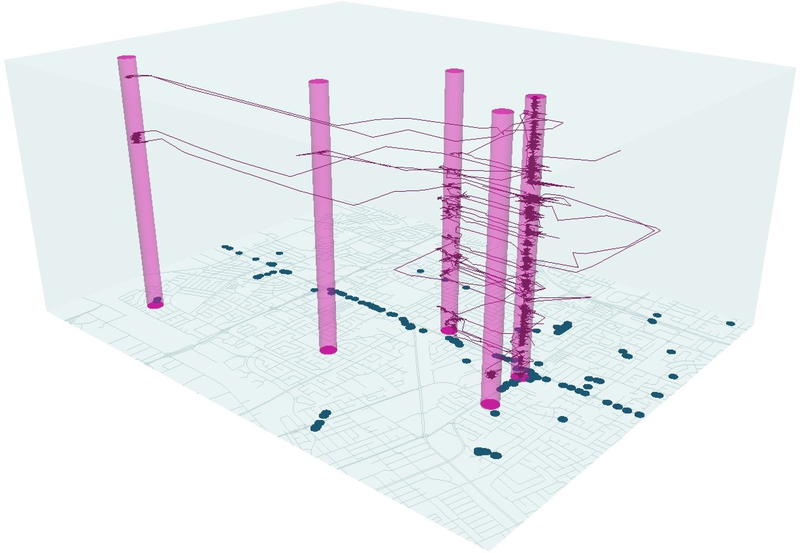
Figure 1.
Space-time aquarium, showing a four-week activity path for one participant. The z-axis represents time, the blue points are alcohol outlets, the continuous purple line is the participants’ activity path, and the five purple columns are the five activity locations identified by search algorithm. Activity path and map features altered to protect participant confidentiality.

