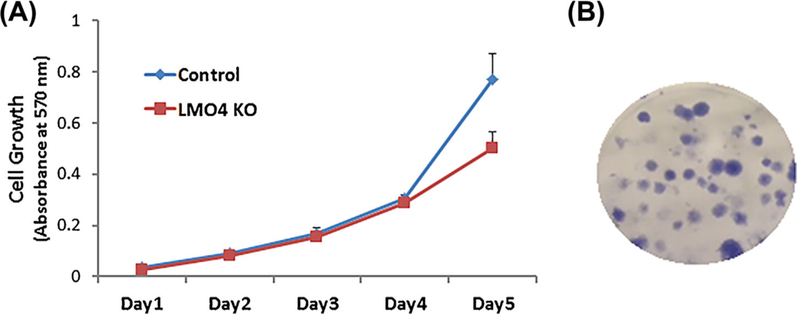
FIGURE 3.

Growth pattern of LMO4 knockout UB/OC1 cells. A, Growth curve of the cells, determined by using MTT calorimetric assay, indicated that the growth rate of the LMO4 knockout cells is similar to that of the control cells during the initial 4 days and is relatively slower on day 5. The results are expressed as mean ± standard deviation, n = 6. B, Representative image of LMO4 knockout UB/OC1 cell colonies, 2 weeks after plating, indicates the survival potential of the cells and their ability to form colonies. The image is representative of three biological replicates.
