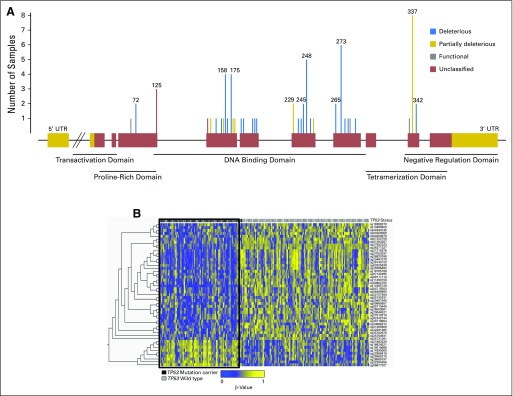
Fig 2.
(A) Spectrum of TP53 mutations in the initial patient cohort. The TP53 gene structure is represented by the linearized horizontal projection, and red boxes denote coding exons, whereas gold regions represent noncoding exons. One mutation per family is depicted. Gray lines indicate mutations that are deleterious but retain functional transactivation. Gold lines indicate mutations that lead to partially functional transactivation mutations, and blue lines indicate mutations that are deleterious and result in nonfunctional transactivation. Red lines denote unclassified mutations. Corresponding protein domains of coding regions are indicated below the gene structure. Codon positions are indicated for mutations that occurred in two or more individuals. (B) Heatmap of the top differentially methylated CpG sites in TP53 mutation carriers versus noncarriers. Individual CpG sites are represented by rows, with row names corresponding to CpG IDs. Columns depict individual patients. Bars above each column indicate TP53 mutation status (black, mutation carrier [n = 72]; gray, noncarrier [n = 111]). The 49 most statistically significant differentially methylated sites determined by the Mann-Whitney U test, after multiple hypothesis testing correction by Benjamini-Hochberg method (q < .05), are shown. A black box delineates the methylation signatures of the prominent TP53 mutation carrier cluster with a preponderance of hypomethylated sites (blue) relative to hypermethylated sites (yellow). UTR, untranslated region.

