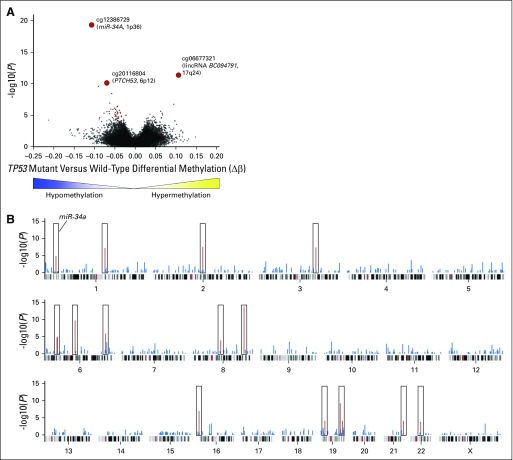
Fig A1.
(A) Volcano plot of differentially methylated CpG sites (DMCs) in deleterious TP53 mutation carriers relative to noncarriers. Differential methylation in absolute methylation levels (Δβ) is depicted on the x-axis, and the y-axis depicts increasing statistical significance determined by the Mann-Whitney U test (−log10 unadjusted P values). Points in red represent CpG sites that reached statistical significance after multiple hypothesis testing correction by the Benjamini-Hochberg method (q < .05). The three most highly significant DMCs are labeled. (B) Modified Manhattan plot of distribution of top DMCs across the genome. To assess the genomic distribution of the most enriched differentially methylated sites, the top 1,000 DMCs were used, and all CpG sites tested within 1 Mb were identified. The hypergeometric statistical test was applied to ascertain the significance of detecting these CpG sites at these loci relative to the total number of CpGs tested at the specified locus. Each CpG site is projected along its chromosomal location, and red peaks denote statistically significant differentially methylated regions (q < .05). lincRNA, long intergenic noncoding RNA.

