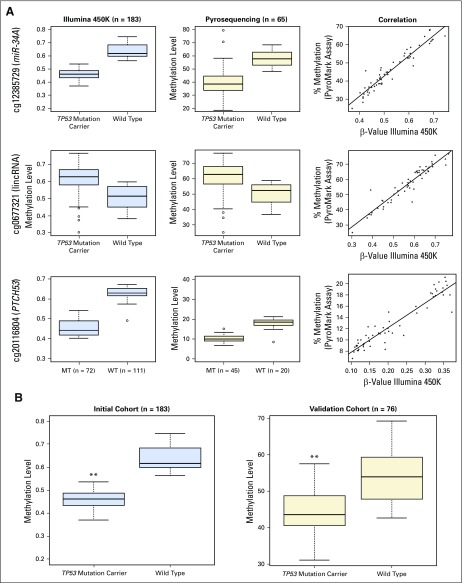
Fig A2.
(A) Verification of methylation levels of top three DMCs. Box plots of methylation levels derived from Illumina 450K Array analysis in initial cohort (n = 183; blue box plots) and methylation levels derived from bisulfite pyrosequencing of a subset of the initial cohort (n = 65; beige box plots). The correlation between these values is represented as a line graph with Illumina 450K Array β-values on the x-axes and bisulfite pyrosequencing results on the y-axes. Data are shown for miR-34A promoter (cg12385729), BC097941 lincRNA (cg0667321), and PTCH53 (C6orf138) (cg2016804). (B) Validation of methylation levels of the top miR-34A promoter CpG site (cg12385729) in an independent patient cohort. Comparison between methylation levels at the miR-34A promoter CpG site cg12385729 is shown in an initial cohort (n = 183) on the basis of the Illumina 450K Array platform (blue box plots) and in an independent validation cohort (n = 76) on the basis of bisulfite pyrosequencing of this CpG site (orange box plots). P values were calculated with univariable two-tailed t tests (initial cohort q = 3.1 × 10⁻¹⁵; validation cohort P < .001). **P < .001. lincRNA, long intergenic noncoding RNA; MT, mutation; WT, wild type.

