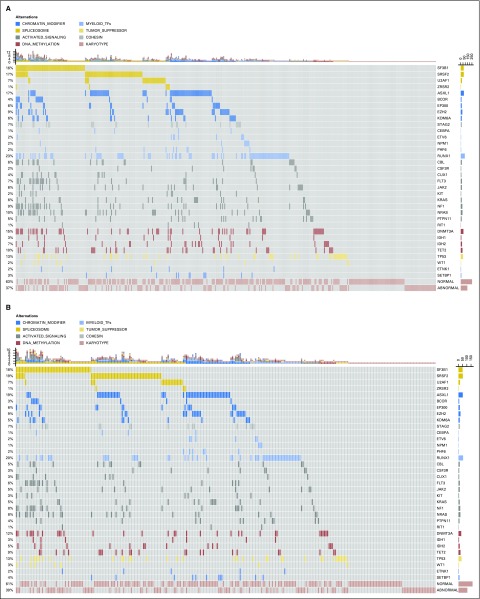
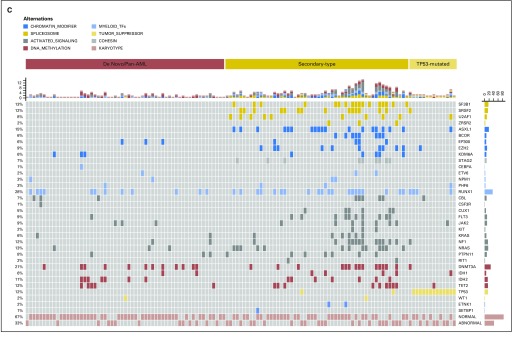
Fig 1.
Mutation patterns observed in patients with myelodysplastic syndromes (MDS) and acute myeloid leukemia evolving from MDS, who were treated with allogeneic hematopoietic stem-cell transplantation. (A) Whole patient population (N = 401); (B) patients with MDS diagnosed according to WHO criteria (n = 274); and (C) patients with acute myeloid leukemia evolving from MDS (n = 127). The plot represents a graphical summary of the distribution of somatic lesions in sequenced genes across the set of patients, grouped in categories as labeled in the legend. Columns represent samples and rows represent genes. Mutations are depicted by colored glyphs whose colors are used to distinguish different pathways, and their number per sample and per gene is summarized on the top and on the right side of the plot, respectively. In panel C, colors reflect ontogeny specificity of mutated genes, and genetic ontogeny groups are labeled on the top.


