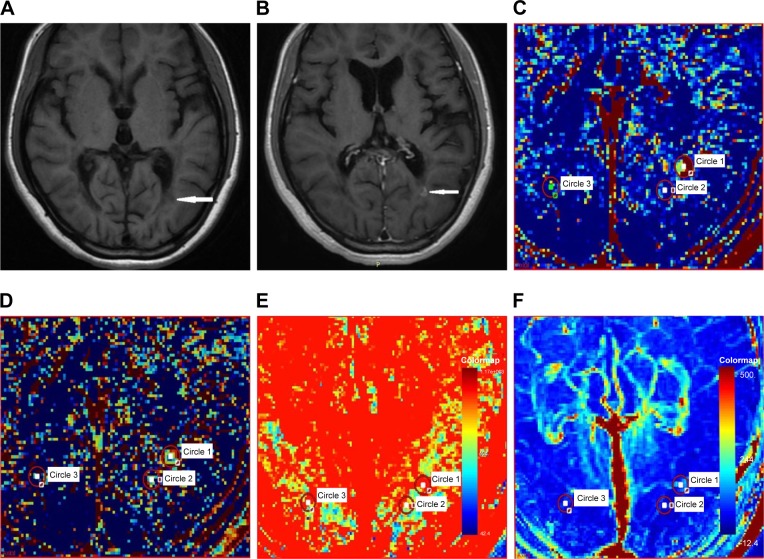
Figure 2.
The representative images of dynamic contrast-enhanced magnetic resonance imaging with Patlak model.
Notes: A 24-year-old patient with RRMS. (A) Precontrast T1-weighted: round low signal in the left periventricular areas (arrow). (B) Dynamic contrast-enhanced T1-weighted images: the lesion was enhanced in T1-weighted contrast-enhanced sequences (arrow). (C) Ktrans map. (D) Vp map. (E) CBF map. (F) CBV map. ROI 1 located in CE lesions (Circle 1), ROI 2 located in the NAWM regions close to the lesions (Circle 2), ROI 3 located in the NAWM regions far from the lesions (Circle 3). For the color maps (C–F), red color represents a high value, blue color represents a low value.
Abbreviations: CBF, cerebral blood flow; CBV, cerebral blood volume; Ktrans, volume transfer constant; NAWM, normal-appearing white matter; ROI, region of interest; RRMS, relapsing–remitting multiple sclerosis; Vp, fractional plasma volume.

