Figure 7.

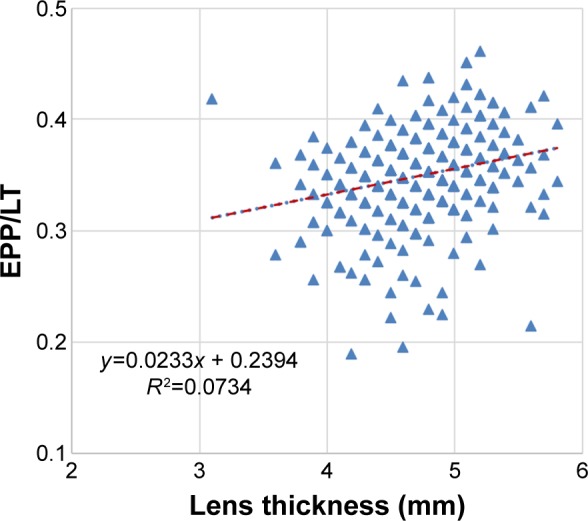
Scatter plot showing the correlation of ratio of equatorial plane position/lens thickness (EPP/LT) with LT (r=0.267).
Note: The dotted line represents the regression line.

Scatter plot showing the correlation of ratio of equatorial plane position/lens thickness (EPP/LT) with LT (r=0.267).
Note: The dotted line represents the regression line.