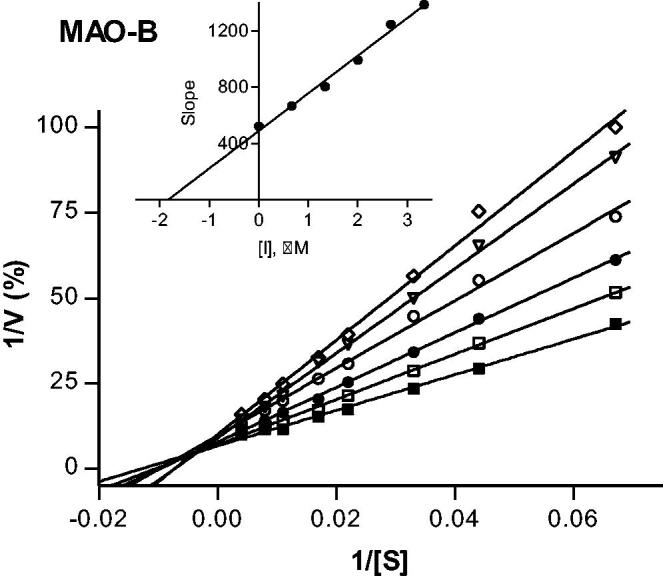
Figure 4.

Lineweaver–Burk plots of hMAO-B activities in the absence (filled squares) and presence of various concentrations of compound 37 (IC50 = 2.67 μM). For these studies the concentrations of compound 37 employed were: ¼ × IC50, ½ × IC50, ¾ × IC50, 1 × IC50 and 1¼ × IC50. The inset is a graph of the slopes of the Lineweaver–Burk plots versus inhibitor concentration (Ki = 1.84 μM).
