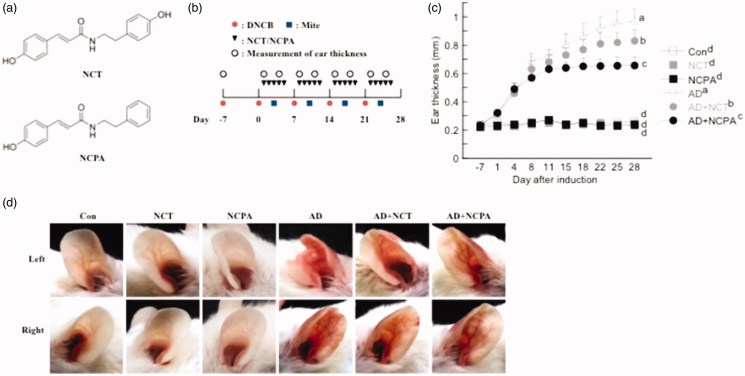
Figure 1.
(a) Structures of NCT and NCPA. (b) Schematic depiction of the induction and NCT and NCPA treatment of atopic dermatitis (AD). (c) Ear thickness during the course of AD. (d) Representative photographs of mouse ears from each group at 28 days after AD induction. Means denoted with different letters (a–d) within a graph are significantly different from each other at p < 0.05.

