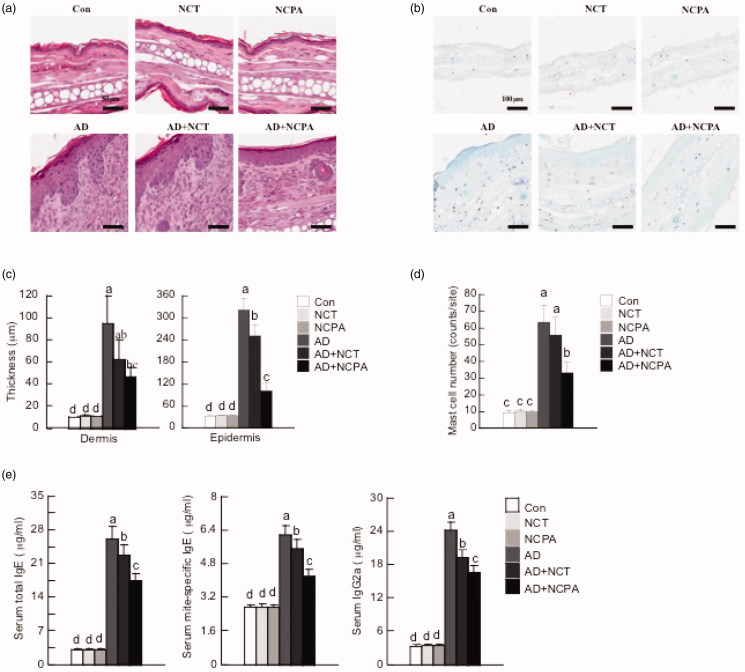
Figure 2.
Histopathological and serum analysis to assess the effect of NCT and NCPA on atopic dermatitis (AD). Representative photomicrographs of ear skin tissue sections stained with hematoxylin and eosin or toluidine blue. (a,b) Epidermal and dermal thicknesses were measured using microphotographs of hematoxylin- and eosin-stained-tissue. (c,d) The number of infiltrated mast cells was determined based on toluidine blue staining. (e) Blood samples were collected by orbital puncture at day 28. Plasma total IgE, mite-specific IgE, and IgG2a levels were quantified by enzyme-linked immunosorbent assay. Data are presented as the mean ± SD of triplicate experiments. Means with different letters (a–d) within each graph are significantly different from each other at p < 0.05. AD was induced by DFE and DNCB treatment. The pictures shown are representative of each group (n = 3–6). The original magnification was 100 × CON. CON: control; AD: atopic dermatitis.

