Figure 5.
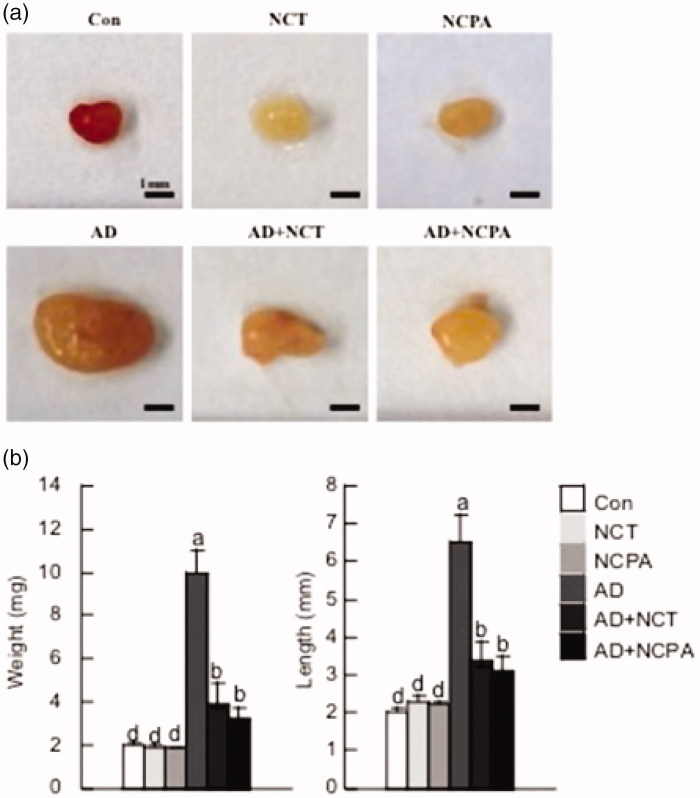
Representative photographs showing the size (a) and weight and length (b) of the cervical lymph nodes of the six mouse groups 28 days after AD induction. The data are represented as mean ± SD. Means denoted with different letters (a–d) within each graph are significantly different from each other at p < 0.05.

