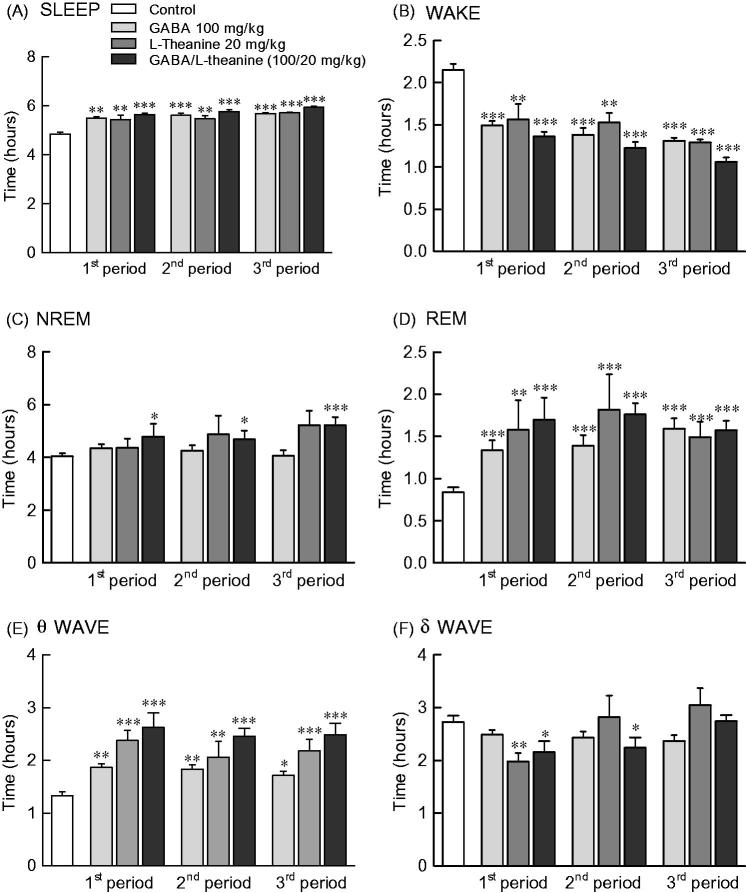
Figure 4.
Effects of GABA, l-theanine, and GABA/l-theanine mixture on sleep quantity and quality during administration periods. Values are presented as the means ± standard error (SE) for each group, n = 8. Symbols indicate significant differences by Bonferroni test, as ***p < 0.001, **p < 0.01, *p < 0.05.

