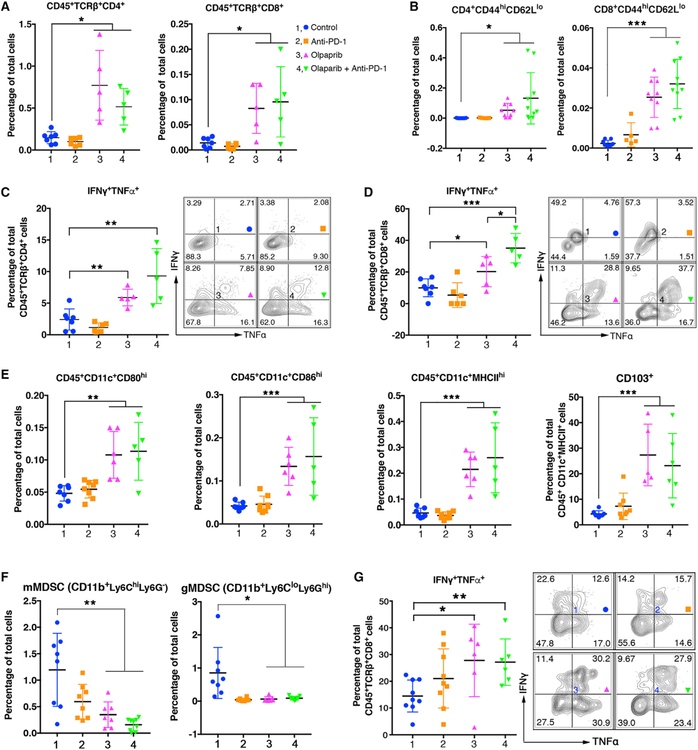
Figure 2. Olaparib Elicits Intratumoral and Systemic Immune Responses in PBM Tumor-Bearing Mice.
(A) Flow cytometric analysis of intratumoral CD4+ and CD8+ T cell population in PBM tumors treated with indicated agents.
(B) Intratumoral CD4+ and CD8+ effector T cells (CD44highCD62Llow) in PBM tumors analyzed by flow cytometry.
(C and D) Flow cytometric analysis of effector cytokine production of intratumoral CD4+ (C) and CD8+ (D) T cell in PBM tumors treated with indicated agents.
(E) Flow cytometric analysis of cell surface markers (CD80, CD86, MHCII, CD103) of intratumoral CD11c+ DCs in PBM tumors.
(F and G) Flow cytometric analysis of blood samples from PBM tumor-bearing mice treated indicated agents.
(F) Analysis of monocytic MDSCs (mMDSCs) and granulocytic MDSCs (gMDSCs).
(G) Analysis of TNFα and interferon (IFN)γ production CD8+ T cells.
Data are represented as mean ± SD. Each dot represents data obtained from one mouse. *p < 0.05, **p < 0.01, and ***p < 0.001.

