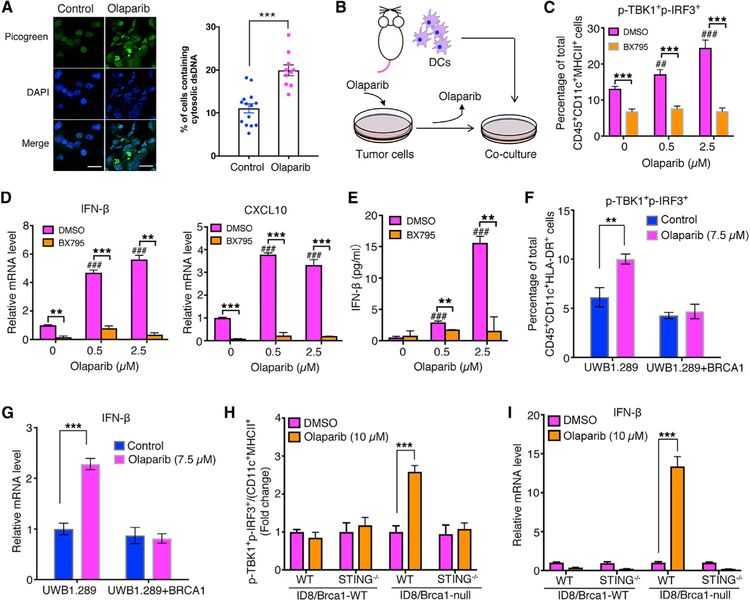
Figure 3. Olaparib-Treated Brca1-Deficient Tumor Cells Trigger STING Pathway Activation in DCs in a Co-culture system.
(A) Staining of cytosolic double-strand DNA (dsDNA) in PBM tumor cells treated with DMSO or olaparib (2.5 μM, 24 hr). Scale bar, 25 μm. Quantification data are presented as mean ± SEM of three independent experiments (n = 10–14 fields, ≥400 cells counted per condition).
(B) Illustration of a co-culture system with BMDCs and olaparib-treated cells.
(C) Flow cytometric analysis of STING pathway activation (p-TBK1+p-IRF3+) in BMDCs co-cultured with olaparib-treated PBM tumor cells, in the presence or absence of a STING inhibitor BX795.
(D) RT-qPCR analysis of IFN-β and CXCL10 expression in BMDCs collected from BMDC/PBM co-culture.
(E) Analysis of IFN-β level in the BMDC/PBM co-culture media by ELISA.
(F and G) Human DCs co-cultured with olaparib-treated human ovarian cancer cell lines UWB1.289 and UWB1.289+BRCA1. (F) Flow cytometric analysis of phosphorylated TBK1 and IRF3 and (G) RT-qPCR analysis of IFN-β expression in human DCs from co-culture.
(H and I) WT and STING−/− BMDCs co-cultured with WT or Brca1-null ID8 tumor cells pretreated with DMSO or olaparib. (H) Flow cytometric analysis of p-TBK1+p-IRF3+ and (I) RT-qPCR analysis of IFN-β expression level in DCs from co-culture with ID8 cells.
Data are represented as mean ± SD; n = 3. *p < 0.05, **p < 0.01, and ***p < 0.001.

