
Fig. 5.
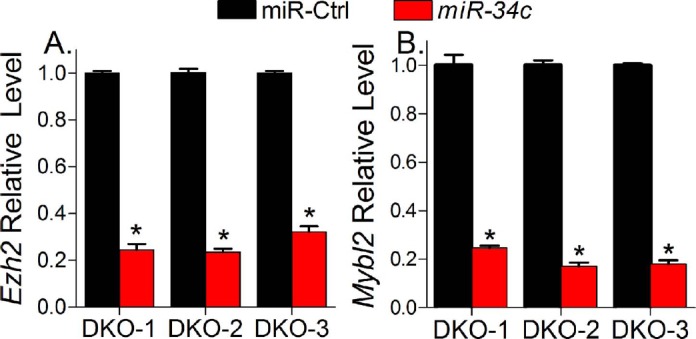
miR-34c suppressed the expression of Ezh2 and Mybl2. QPCR analysis shows relative quantity of Ezh2 (A) and Mybl2 (B) after miR-34c transfection in DKO-1, DKO-2, and DKO-3 cells. Data are expressed as mean values ± SEM for three determinations (*P < 0.05).