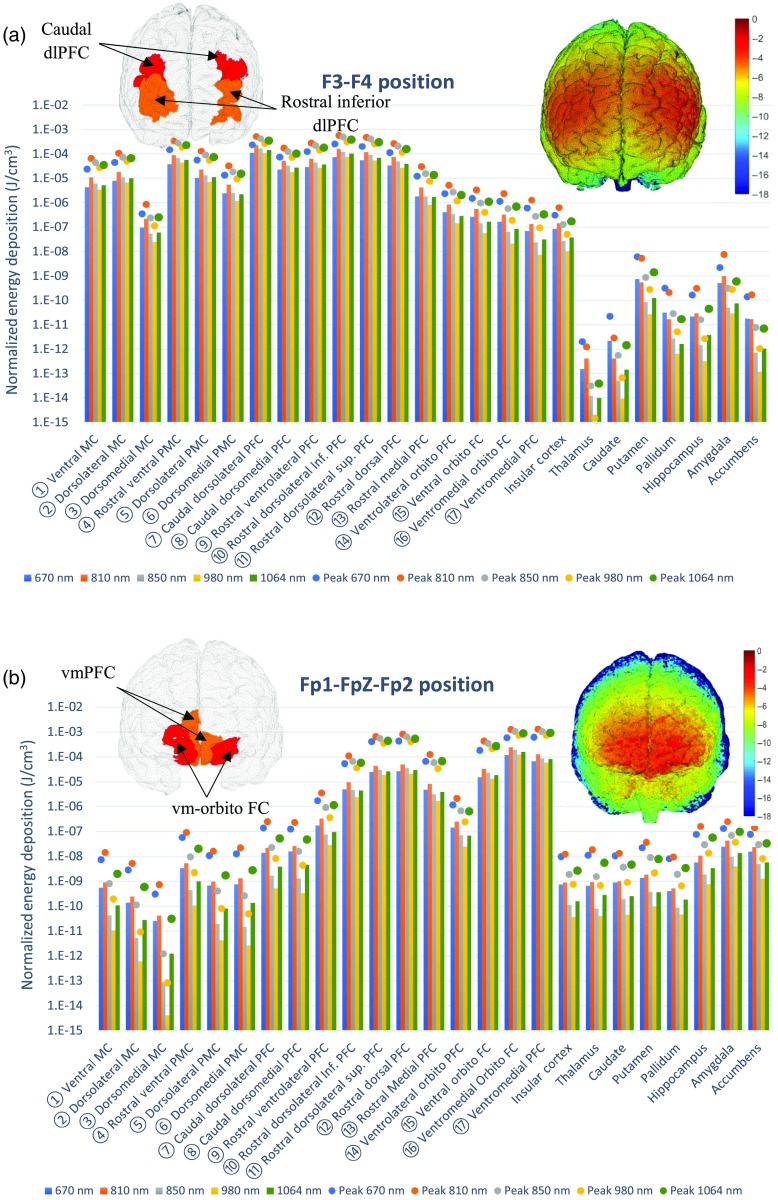
Fig. 2.
The average (bars) and peak (dots) energy deposition () after positioning the extracranial light source on the: (a) F3 site and F4 site (two devices simultaneously) and (b) Fp1–FpZ–Fp2 sites (one device). The left inset shows the ROIs that receiving the highest (red) and second highest (orange) energy deposition; the right-inset shows the energy deposition () map on the cortical surface. The locations of the numbered ROIs are shown in Fig. 1(c).

