Fig. 2.

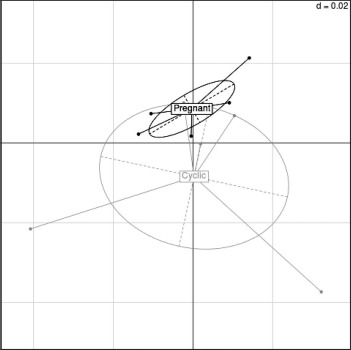
Correspondence analysis demonstrating the source of greatest variation in the oviduct transcriptional profile in experiment 1. Each dot represents all the transcripts expressed on one microarray representing one tissue site from one animal.

Correspondence analysis demonstrating the source of greatest variation in the oviduct transcriptional profile in experiment 1. Each dot represents all the transcripts expressed on one microarray representing one tissue site from one animal.