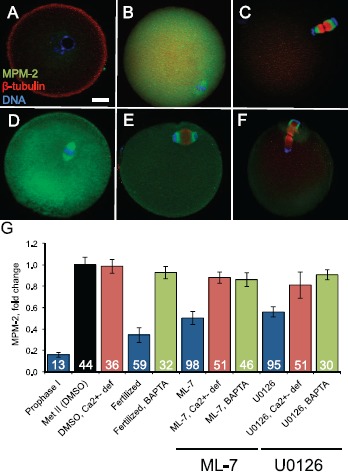
Fig. 5.

Analysis of M-phase phospho-protein levels detected by MPM-2 staining. The monoclonal antibody MPM-2, which reacts with M-phase-specific phospho-epitopes, was used to assess M-phase status in individual eggs. A–F) Representative eggs that were stained with MPM-2 (green), anti-β-tubulin (red), and DAPI (blue) are shown. A–C show control cells at prophase I, metaphase II, and embryonic interphase (embryos fixed at 3 h postinsemination). Prophase I oocytes have low CDK1 activity and thus a low MPM-2 signal. Metaphase II arrested eggs have high CDK1 activity and thus a high MPM-2 signal. Early embryos have low CDK1 activity and low MPM-2 signal. D–F show representative eggs treated with 15 μM ML-7 or 50 μM U0126. D shows a representative egg with a metaphase II spindle that has drifted away from the cortex. E and F show representative eggs that have progressed to anaphase II and telophase II following inhibitor treatment. Bar in A = 10 μm for A–F. G) Quantification of the intensity of MPM-2 signals in eggs in the different experimental treatment groups. Numbers in bars indicate the numbers of eggs analyzed in each experimental group. Error bars represent standard error of the mean. Metaphase II DMSO-treated eggs are shown in the black bar. Prophase I oocytes, fertilized eggs, and ML-7-treated and U0126-treated eggs are shown in blue. The average MPM-2 signal intensities in ML-7- and U0126-treated eggs were statistically significantly different (P < 0.05; ANOVA with Fisher's protected least significant different post hoc testing) compared to DMSO-treated eggs (black bar). Eggs in which intracellular Ca2+ was chelated by pretreating with BAPTA-AM are shown in green combined with either fertilization (labeled fertilized: these eggs do not exit from metaphase II arrest and thus have high MPM-2 signals) or with ML-7 or U0126 treatment. Eggs that were treated with DMSO, ML-7, or U0126 in Ca2+-deficient medium are shown in in red. The average MPM-2 signal intensities for ML-7- and U0126-treated eggs without BAPTA-AM and in Ca2+-containing medium (blue bars) were statistically significantly different as compared to the comparable drug treatment group with either BAPTA-AM loading (green bars) or when drug treatment occurred in Ca2+-deficient medium (red bars) (P < 0.05; ANOVA with Fisher's protected least significant difference post hoc testing).
