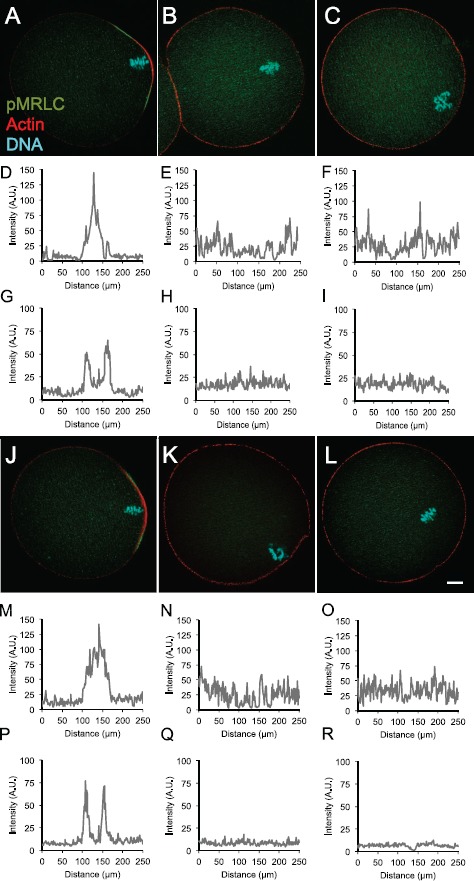
Fig. 6.

Effects of U0126 or ML-7 treatment ± zinc ionophore on actin and pMRLC. Eggs were treated with DMSO, ML-7, or U0126 for 3 h, or were pretreated with 10 μM zinc pyrithione (ZnPT) for 5 min, then with DMSO, ML-7, or U0126 for 3 h prior to localization of pMRLC and actin. Numbers of eggs analyzed: DMSO, nine; ML-7, nine; U0126, 17; DMSO+ZnPT, seven; ML-7+ZnPT, 14; and U0126, 13. Representative fluorescence images of pMRLC (green), actin (red), and DNA (blue) are shown for eggs treated with DMSO (A), ML-7 (B), or U0126 (C), DMSO+ZnPT (J), ML-7+ZnPT (K), or U0126+ZnPT (L). D–F and M–O are data from line scans around the circumference of the egg (starting at the point opposite the DNA) of cortical actin signals in A–C. The peaks in D and M correspond to the cortical actin cap overlying the DNA in A and J, respectively. The line scans in E, F, N, and O have no distinct peak, coinciding with the loss of the actin cap overlying the DNA following inhibitor treatment in B, C, K, and L, respectively. G–I and P–R are line scans of the cortical pMRLC fluorescence in A–C and J–L, respectively. The data in G and P show two distinct peaks, associated with pMRLC localization at the boundary of the amicrovillar domain in A and J, respectively. The line scans in H, I, Q, and R do not show these distinct peaks. Bar in L = 10 μm and is applicable to all images.
